Visual examples
Explain a flow using colors and steps
Combine a thicker blue border, a translucent blue fill, numbered dots and a green note. The elements remain interactive.
*** Settings ***
Library    SeleniumLibrary
Library    Marka

*** Test Cases ***
Explain Profile Changes
    # Browser is already open on the profile form.
    Highlight Element    id:email    color=\#2673D9    background=rgba(38,115,217,0.12)    width=5    group=profile
    Add Dot    id:email    text=1    color=\#2673D9    position=left    group=profile
    Add Dot    id:save    text=2    color=\#2673D9    position=left    group=profile
    Add Note    id:save    text=Save profile changes    color=\#567344    position=right    group=profile
    Click Element    id:save
    Capture Annotated Screenshot    ${OUTPUT DIR}/profile.png
Capture from Python
Use the browser already opened by your tests. Capture returns an absolute path and clears annotations by default.
from marka import Annotator
from selenium.webdriver.common.by import By

marks = Annotator(driver)  # existing Selenium WebDriver
email = driver.find_element(By.ID, "email")
marks.add(email, color="#2673D9", background="rgba(38,115,217,0.12)", width=5)
marks.add(email, kind="dot", text="1", color="#2673D9", position="left")
path = marks.capture("output/profile.png")
Annotated screenshot and processing
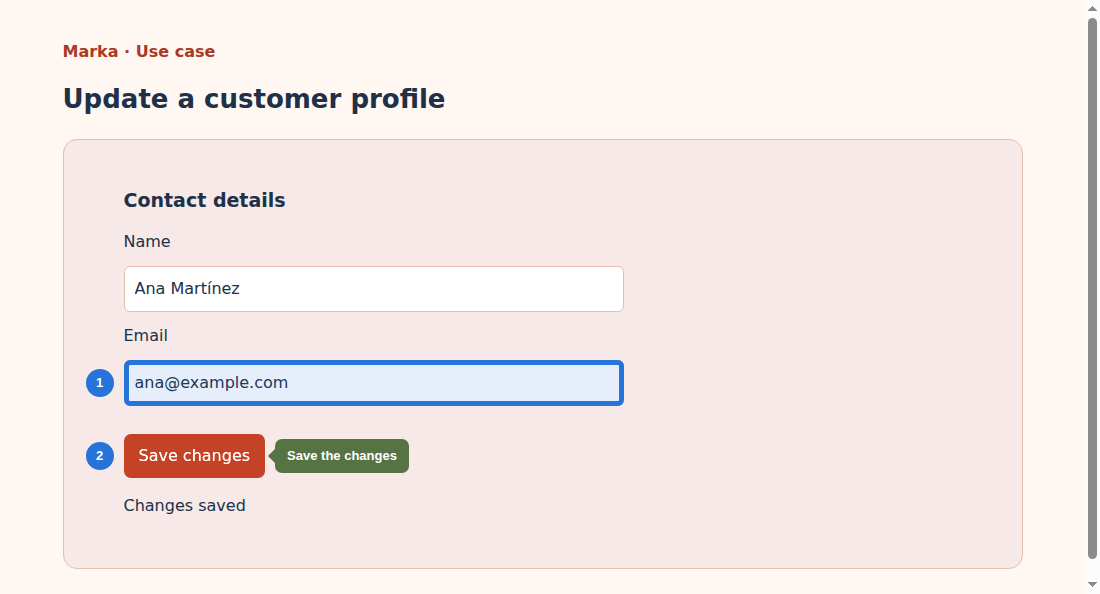
This capture comes from a local customer-profile fixture annotated and captured through the Python Annotator API. It shows the business form and its explanation, without the demo controls. The fixture is supplied only to demonstrate the use case.
- Locate elements in the selected window/frame.
- Create independent overlays that follow the element and allow clicks.
- Capture the viewport as PNG and clear annotations; use clear=${False} to keep them.
Capture does not crop regions or stitch a full page. You can attach the PNG to Evidence Reporter as evidence.
Interactive demo
The language follows the documentation. Choose highlight, dot and note colors and adjust border width. Clear before trying another combination.